Monitoring is what closes that gap — but "GPU monitoring" isn't one tool, it's a stack, and which pieces you need depends on whether you're debugging one server or watching a fleet. Here's a practical breakdown of what's actually used in production AI/GPU environments right now, and where each tool fits.
Command-Line Tools: For Quick, Local Diagnosis
These aren't fleet monitoring solutions — they're what you reach for when you're SSH'd into a box and need to know what's happening right now.
nvidia-smi is the default that ships with the NVIDIA driver. It shows GPU utilization, memory usage, temperature, and running processes in a static snapshot. It's always available, but it's not built for continuous visual monitoring.
nvtop improves on that with a live-updating terminal interface — think htop, but for GPUs. It shows rolling utilization and memory graphs directly in the terminal, color-codes compute versus memory versus encode/decode load, and lists exactly which processes are consuming GPU resources. It has no dependencies, no database, and no config file, which makes it genuinely useful as a first-response diagnostic tool. Its limitation is also its defining trait: it only shows what's happening while you're watching. No history, no alerting, no remote access.
gpustat is a lighter, simpler alternative aimed at quick one-line status checks — useful for scripting or a fast glance without nvtop's fuller interface.
All three are good starting points, but none of them answer the question that actually matters at scale: what happened to this GPU over the last three days, and should someone have been alerted?
The Production Stack: DCGM, Prometheus, and Grafana
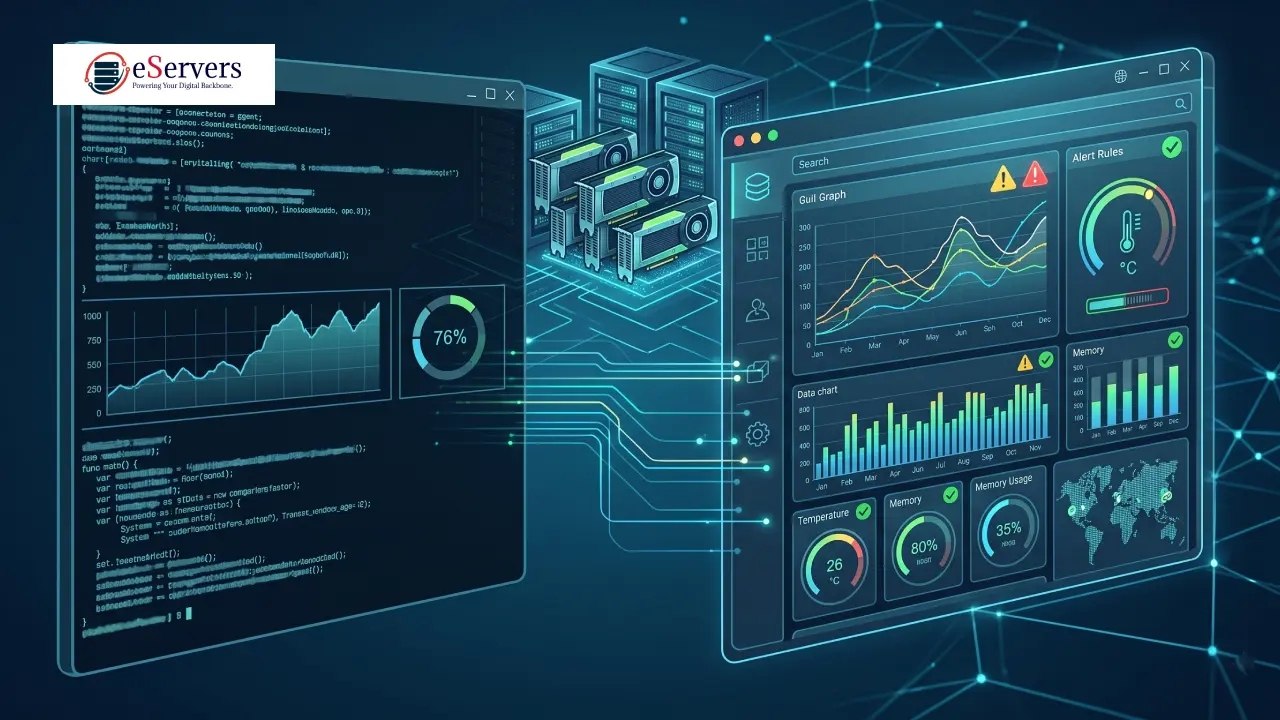
For anything beyond a single server you're personally watching, the standard production stack is NVIDIA DCGM (Data Center GPU Manager) paired with DCGM Exporter, Prometheus, and Grafana.
DCGM is NVIDIA's own toolkit for data-center-grade GPU telemetry and health checks — it goes deeper than nvidia-smi, exposing metrics tied to actual hardware health, not just current usage.
DCGM Exporter takes that data and exposes it in Prometheus format, which is what makes it usable in a normal DevOps monitoring pipeline instead of a proprietary one.
Prometheus scrapes and stores that data as time series, and lets you query it with PromQL — filtering by GPU model, host, or process.
Grafana turns those time series into dashboards, with alerting rules for thresholds like VRAM usage, temperature, or power draw.
This combination is specifically strong for NVIDIA-heavy, Linux-based AI/ML clusters doing training or inference, and it's the setup most teams converge on once they outgrow terminal tools. The main tradeoff: it's NVIDIA-specific, and it takes real setup work — Docker Compose configs, dashboard imports, data source wiring — compared to the zero-config nature of nvtop.
One practical warning worth knowing if you're setting this up: older public Grafana dashboard templates (some dating back to 2021) often don't render correctly against current DCGM v3.3+ metric names, and will show "No Data" even when the pipeline is working. Pull a current dashboard JSON rather than reusing an old dashboard ID.
All-in-One Observability Platforms
If GPU monitoring needs to live alongside monitoring for everything else on the box — CPU, disk, network, containers — a few platforms fold GPU metrics into a broader system view instead of treating them as a separate pipeline:
Netdata auto-detects NVIDIA GPUs via nvidia-smi and AMD GPUs via rocm-smi, streaming real-time metrics into its own web dashboard alongside standard system metrics. It's a reasonable middle ground between a terminal tool and a full Prometheus/Grafana deployment.
Datadog and New Relic connect GPU telemetry to application-level signals — logs, traces, distributed workloads — which matters most when you need to trace a GPU-related incident back to specific application behavior, not just see that a GPU spiked.
Sysdig takes a Kubernetes-first approach, correlating GPU activity with specific pods and containers, which is useful if your AI workloads are containerized and you need to know which workload is responsible for a spike, not just that one occurred.
Telegraf is more of a building block than a platform — a pluggable agent for pulling GPU metrics into whatever time-series backend you're already standardized on.
These tools generally cost more (or require a hosted account) compared to the fully self-hosted DCGM/Prometheus/Grafana stack, but they save the integration work of wiring GPU metrics into an existing observability setup that already covers the rest of your infrastructure.
What to Actually Track
Regardless of which tools you pick, the metrics that matter for AI/GPU workloads are fairly consistent:
GPU utilization — is the card actually being used, or sitting idle while requests queue?
VRAM usage — the most common failure mode for inference servers; hitting the ceiling causes OOM errors and dropped requests, not a graceful slowdown.
Temperature and thermal throttling — sustained high load without adequate cooling silently reduces clock speed and throughput long before it triggers a shutdown.
Power draw — increasingly tracked as a first-class metric, since power consumption per accelerator has climbed with newer GPU generations, and it's often the earliest signal of a workload change.
Process-level attribution — knowing which process or container is consuming a given GPU's resources, not just that "a GPU" is busy.
Choosing a Setup Based on Your Situation
| Situation | Recommended tools |
|---|---|
| Single server, quick diagnosis | nvidia-smi, nvtop |
| Small NVIDIA-only cluster, self-hosted | DCGM Exporter + Prometheus + Grafana |
| Kubernetes/container-based AI workloads | DCGM Exporter + Sysdig or Prometheus |
| Mixed infrastructure (GPU + everything else) | Netdata, or Datadog/New Relic if budget allows |
| Deciding whether to scale to more/bigger GPUs | Weeks of historical utilization and VRAM data from Prometheus/Grafana — this is the evidence base for that decision, not a single snapshot |
Next Steps
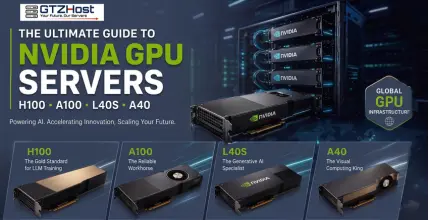
If you're setting up monitoring on a fresh GPU server, make sure the NVIDIA driver and container runtime are configured first — see our guide on installing the NVIDIA Container Toolkit with Docker. And if the monitoring data shows your current server is consistently maxed out, that's usually the signal to look at deploying a dedicated NVIDIA GPU server for AI workloads rather than continuing to squeeze a single card.
View GTZ Host Dedicated Server PlansFrequently Asked Questions (FAQ)
Do I need Prometheus and Grafana if I only have one GPU server?
Not necessarily. For a single box you check occasionally, nvtop is often enough. The production stack earns its setup cost once you have multiple servers, need historical data, or want alerting instead of manual checks.
Does DCGM work with AMD GPUs?
No — DCGM is NVIDIA-specific. For mixed NVIDIA/AMD fleets, a platform like Netdata (which supports both via nvidia-smi and rocm-smi) is a better fit than building around DCGM.
What's the earliest warning sign of a GPU about to cause problems?
Sustained VRAM usage near capacity and gradually rising temperatures under normal load are usually the earliest signals — both show up in monitoring well before an actual OOM error or thermal shutdown occurs.
Is nvidia-smi enough for production monitoring?
On its own, no — it has no history and no alerting. It's still useful as the underlying data source that tools like nvtop, DCGM, and Netdata all build on.